공부 목적으로 설치해 보는 과정을 정리한 것이기 때문에 실제 운영과 다릅니다.
OpenTelemetry 소개
application의 상태를 계측하기 위한 단계는 간략하게 계측 데이터 수집 -> 저장 -> 모니터링의 세 단계로 나누어 볼 수 있다. (이 구분이 절대적인 정의는 아니다.)
각 역할별로 제공되는 여러 라이브러리를 조합해서 사용하는데 ELK(ElasticSearch + Logstash + Kibana), EFK (ElasticSearch + Fluentd + Kibana), PLG (Promtail + Loki + Grafana) 등 다양한 조합이 있고 보통 해당 라이브러리를 만든 회사의 제품들을 묶은 제품군(stack)으로 사용하게 된다.
또한 수집하는 계측 데이터(log, metric, trace)의 특성에 따라 수집 방법 및 저장소도 다양하다 보니 제품군을 묶어 제공하는 게 언뜻 효과적으로 느껴진다.
하지만 시간이 지나면 어떤 라이브러리는 흥하고 어떤 라이브러리는 쇠하게 된다.
기존 라이브러리의 단점을 개선한 라이브러리가 등장하는 반면 인기가 시들해지면서 밀려나는 라이브러리가 생기게 된다.
이렇게 되면 특정 라이브러리를 교체하려고 해도 제품군으로 묶여있어 라이브러리 간 결합이 심할수록 변경하기엔 많은 비용이 들어간다.
하나를 교체하려면 엮여있는 것까지 교체해야 하기 때문이다.
OpenTelemetry(Otel)는 계측 데이터를 수집하고 내보내는 다양한 라이브러리의 API 형식을 표준화하고 다양한 언어에 대해 SDK를 제공하기 위해 만들어졌다.
OpenTelemetry를 사용하여 이렇게 공통된 API를 사용하여 수집하고 저장하면 교체 비용을 줄이고 필요한 부분만 교체가 가능하게 된다.
OpenTelemetry Collector
OpenTelemetry Collector는 application이 보낸 데이터를 수집(receivers)하고 가공(processors)하여 저장소로 내보내는(expporters) 역할을 한다.
https://opentelemetry.io/docs/collector/getting-started/
수집 -> 저장의 단계 사이에 OpenTelemetry Collector의 단계가 추가되면서 수집과 저장의 라이브러리 간 결합도를 없애고 표준화된 API를 사용하기 때문에 수집을 위한 라이브러리와 저장을 위한 라이브러리 각각의 변경에 부담이 없어지게 된다.
(이 역할만이 전부는 아니다. 가져와서 가공하고 내보내는 역할이기 때문에 어디서 가져오고 어디로 내보낼지는 구성하기 나름이다.
수집 -> Otel Collector -> 저장뿐만 아니라 저장소에서 가져와서 다른 곳으로 보낼 수도 있다.
또한 보내는 쪽/받는 쪽에도 OTLP(OpenTelemetry Protocol)를 사용하기 위해 OpenTelemetry를 사용할 수 있다.)

OpenTelemetry Collector는 단일 바이너리로 제공되며 두 가지 배포 방법을 구성할 수 있다.
https://opentelemetry.io/docs/concepts/data-collection/
- Agent : application과 함께 실행되거나 application과 동일한 호스트에서 실행되는 Collector instance (예: binary, sidecar 또는 daemonset)
- Gateway : 일반적으로 cluster, data center 또는 region 별로 standalone service (예: container 또는 deployment)로 실행되는 하나 이상의 Collector instance
둘 중 agent를 추천한다고 한다.
자세한 예제는 아래 링크에서 살펴보면 된다.
https://github.com/open-telemetry/opentelemetry-operator
구현 목표
이 글에서 목표는 계측의 log, metric, trace 중 trace 데이터에 대한 처리를 구성해 보는 것이다.
java 프로젝트에서 OpenTelemetry Collector를 사용할 경우 metric과 trace에 대한 처리는 Stable 하지만 log에 대해서는 아직 Experimental 상태이다.
https://opentelemetry.io/docs/instrumentation/
현재 log에 대한 처리도 제공해주긴 하지만 이후 Stable 상태가 되기 전까진 metric과 trace에 대해서만 OpenTelemetry를 적용하면 좋을 것 같다.
https://www.giorgosdimtsas.net/blog/collecting-spring-boot-telemetry-data-with-opentelemetry
다만 metric을 수집하는 건 이전 글에서 prometheus를 통해 간단하게 구현하였었다.
굳이 중간에 Otel Collector를 추가하지 않아도 될 듯하다.
따라서 이 글에서는
- OpenTelemetry Collector를 pod로 띄우고
- Spring Boot 3.x 기반의 application에서 agent를 사용하지 않고 application 내에서 trace 정보를 export 하며
- OpenTelemetry Collector가 receive 한 내용을 tempo로 export 한 후
- Grafana에서 tempo의 trace를 확인하려고 한다.
(이 방식 이외의 구현은 앞서 소개한 링크에서 참조하면 된다.)
Spring Boot 3.0 이후 Project에서 Trace 계측 구현하기
Spring Boot 3.0 이전에는 Spring Cloud Sleuth + opentelemetry-exporter-otlp-trace을 사용하여 trace를 계측할 수 있었다.
Spring Boot 3.0 이후에는 Spring Cloud Sleuth는 더 이상 지원하지 않으며 Spring Cloud Sleuth 대신 Micrometer의 Tracing를 사용하게 될 예정이다.
https://docs.spring.io/spring-cloud-sleuth/docs/current/reference/html/
Micrometer는 다양한 계측 클라이언트에 대한 간단한 facade를 제공한다.
(Log에서 SLF4J가 하던 역할이라고 생각하면 된다.)
https://micrometer.io/
Spring Cloud Sleuth의 마지막 지원 버전은 3.1이며 이후 Spring Boot 3에서 Micrometer metric을 사용하는 Auto Configuration으로 마이그레이션에 대해 대해 아래 글에서 소개하고 있다.
https://github.com/micrometer-metrics/tracing/wiki/Spring-Cloud-Sleuth-3.1-Migration-Guide
이전 버전 Spring Boot 프로젝트에서도 Micrometer를 사용할 수 있는데 이에 대한 micrometer 사용 예제는 이곳을 참고하면 된다.
https://github.com/micrometer-metrics/micrometer-samples
Spring Boot는 3.0. 이후부터는 현재 OpenTelemetry + (Zipkin or Wavefront) 또는 OpenZipkin Brave + (Zipkin or Wavefront)에 대한 auto configuration을 제공한다.
https://docs.spring.io/spring-boot/docs/current/reference/html/actuator.html#actuator.micrometer-tracing.tracers
내 경우 Opentelemetry와 zipkin을 사용해보려고 한다.
다음과 같이 spring-boot-starter-actuator와 함께 micrometer-tracing-bridge-otel, opentelementry-exporter-zipkin 의존성을 추가한다.
<dependency>
    <groupId>org.springframework.boot</groupId>
    <artifactId>spring-boot-starter-actuator</artifactId>
</dependency>
<dependency>
    <groupId>io.micrometer</groupId>
    <artifactId>micrometer-tracing-bridge-otel</artifactId>
</dependency>
<dependency>
    <groupId>io.opentelemetry</groupId>
    <artifactId>opentelemetry-exporter-zipkin</artifactId>
</dependency>
로그에 traceId가 추가되도록 log pattern을 설정하고 tracing에 대한 probability (trace를 발생시킬 빈도, 1.0 은 100%, 0.5는 50%)와 호출될 zipkin 주소를 설정한다.
zipkin 주소라고 하지만 해당 주소는 OpenTelemetry Collector의 주소이다.
OpenTelemetry Collector가 기존 zipkin의 요청을 동일하게 받아서 수집하게 된다.
logging.pattern.level=%5p [${spring.application.name:},%X{traceId:-},%X{spanId:-}]
management.tracing.sampling.probability=1.0
management.zipkin.tracing.endpoint=http://opentelemetry-collector-service:9411/api/v2/spans
이렇게 설정하면 기본적인 java project의 trace 정보 처리가 끝났다.
collector 쪽의 설정을 하지 않은 채로 프로젝트를 띄우면 trace를
OpenTelemetry Collector 설정하기
다음과 같이 설정하였다.
spring boot 프로젝트에서 zipkin으로 전달받아 otlp로 내보내도록 설정하였다.
apiVersion: apps/v1
kind: Deployment
metadata:
  name: opentelemetry-collector-deployment
  labels:
    app: opentelemetry-collector
spec:
  selector:
    matchLabels:
      app: opentelemetry-collector
  template:
    metadata:
      labels:
        app: opentelemetry-collector
    spec:
      containers:
      - name: opentelemetry-collector
        image: otel/opentelemetry-collector:latest
        command:
        - /otelcol
        - --config=/conf/collector.yaml
        ports:
        - name: jaeger-compact
          containerPort: 6831
          protocol: UDP
        - name: jaeger-grpc
          containerPort: 14250
          protocol: TCP
        - name: jaeger-thrift
          containerPort: 14268
          protocol: TCP
        - name: otlp
          containerPort: 4317
          protocol: TCP
        - name: otlp-http
          containerPort: 4318
          protocol: TCP
        - name: zipkin
          containerPort: 9411
          protocol: TCP
        volumeMounts:
        - name: opentelemetry-collector-config
          mountPath: /conf
      volumes:
      - name: opentelemetry-collector-config
        configMap:
          name: opentelemetry-collector-configmap
          items:
          - key: collector.yaml
            path: collector.yaml
---
apiVersion: v1
kind: ConfigMap
metadata:
  name: opentelemetry-collector-configmap
data:
  collector.yaml: |
    receivers:
      zipkin:
    processors:
    exporters:
      otlp:
        endpoint: tempo-service:4317
        tls:
          insecure: true
      logging:
        loglevel: info
    service:
      pipelines:
        traces:
          receivers:
          - zipkin
          processors: []
          exporters:
          - logging
          - otlp
---
apiVersion: v1
kind: Service
metadata:
  name: opentelemetry-collector-service
  labels:
    app: opentelemetry-collector
spec:
  selector:
    app: opentelemetry-collector
  ports:
  - name: jaeger-compact
    port: 6831
    targetPort: 6831
    protocol: UDP
  - name: jaeger-grpc
    port: 14250
    targetPort: 14250
    protocol: TCP
  - name: jaeger-thrift
    port: 14268
    targetPort: 14268
    protocol: TCP
  - name: otlp
    port: 4317
    targetPort: 4317
    protocol: TCP
    appProtocol: grpc
  - name: otlp-http
    port: 4318
    targetPort: 4318
    protocol: TCP
  - name: zipkin
    port: 9411
    targetPort: 9411
    protocol: TCP
OpenTelemetry의 좀 더 자세한 설정은 관련 문서를 참고하면 된다.
https://opentelemetry.io/docs/collector/configuration/
Grafana Tempo 설치하기
계측 데이터는 각 데이터 특성에 따라 database가 다르다.
log는 elasticsearch, grafana loki 같은 logging & 분석(검색) database를
metric은 prometheus, Graphite, InfluxDB, OpenTSDB 같은 시계열 데이터 저장소(time series database)를 사용하고
trace는 Jaeger, Tempo, zipkin을 사용한다.
OpenTelemetry를 사용하면 관련 라이브러리 중 어떤 것을 사용해도 되는데 한 번도 써본 적이 없고 Grafana 제품군인 Tempo를 사용해 보았다.
kubernetes yaml 설정은 다음과 같다.
tempo는 데이터 저장소로 GCS, S3, Azure, Parquet을 지원하며 이 중 아마존의 S3의 경우 로컬 저장소인 minio로 대체하여 사용할 수 있다.
apiVersion: apps/v1
kind: Deployment
metadata:
  name: tempo-deployment
  labels:
    app: tempo
spec:
  selector:
    matchLabels:
      app: tempo
  template:
    metadata:
      labels:
        app: tempo
    spec:
      containers:
      - name: tempo
        image: grafana/tempo
        args:
        - -config.file=/conf/tempo.yaml
        ports:
        - containerPort: 3100
          name: prom-metrics
        - containerPort: 6831
          name: jaeger-thrift-c
          protocol: UDP
        - containerPort: 6832
          name: jaeger-thrift-b
          protocol: UDP
        - containerPort: 14268
          name: jaeger-thrift-h
        - containerPort: 14250
          name: jaeger-grpc
        - containerPort: 9411
          name: zipkin
        - containerPort: 55680
          name: otlp-legacy
        - containerPort: 4317
          name: otlp-grpc
        - containerPort: 55681
          name: otlp-http
        - containerPort: 55678
          name: opencensus
        volumeMounts:
        - name: tempo-config
          mountPath: /conf
      volumes:
      - name: tempo-config
        configMap:
          name: tempo-configmap
          items:
          - key: tempo.yaml
            path: tempo.yaml
---
apiVersion: v1
kind: ConfigMap
metadata:
  name: tempo-configmap
data:
  tempo.yaml: |
    server:
      http_listen_port: 3100
    distributor:
      receivers:
        otlp:
          protocols:
            grpc:
            http:
    storage:
      trace:
        backend: s3
        s3:
          bucket: tempo
          endpoint: minio-service:9000
          access_key: minio_access_key
          secret_key: minio_secret_key
          insecure: true
---
apiVersion: v1
kind: Service
metadata:
  name: tempo-service
  labels:
    app: tempo
spec:
  selector:
    app: tempo
  ports:
  - name: tempo-prom-metrics
    port: 3100
    targetPort: 3100
  - name: jaeger-metrics
    port: 16687
    targetPort: 16687
  - name: tempo-query-jaeger-ui
    port: 16686
    targetPort: 16686
  - name: tempo-jaeger-thrift-compact
    port: 6831
    protocol: UDP
    targetPort: 6831
  - name: tempo-jaeger-thrift-binary
    port: 6832
    protocol: UDP
    targetPort: 6832
  - name: tempo-jaeger-thrift-http
    port: 14268
    protocol: TCP
    targetPort: 14268
  - name: grpc-tempo-jaeger
    port: 14250
    protocol: TCP
    targetPort: 14250
  - name: tempo-zipkin
    port: 9411
    protocol: TCP
    targetPort: 9411
  - name: tempo-otlp-legacy
    port: 55680
    protocol: TCP
    targetPort: 55680
  - name: tempo-otlp-http-legacy
    port: 55681
    protocol: TCP
    targetPort: 4318
  - name: grpc-tempo-otlp
    port: 4317
    protocol: TCP
    targetPort: 4317
  - name: tempo-otlp-http
    port: 4318
    protocol: TCP
    targetPort: 4318
  - name: tempo-opencensus
    port: 55678
    protocol: TCP
    targetPort: 55678
Grafana Tempo에 대한 좀 더 자세한 설정은 관련 문서를 참고하면 된다.
https://grafana.com/docs/tempo/latest/configuration/#storage
minio 연동 설정
minio 설치하기
tempo에서 저장소를 minio로 지정하였다.
minio는 설치는 다음과 같다.
ingress나 별도의 게이트웨이를 설정하지 않았다면 외부에서 console을 열기 위해 Service의 Type을 LoadBalancer로 지정하면 된다.
아래에서 설정한 console port는 9001이며 default user/password는 minioadmin/minioadmin이다.
apiVersion: apps/v1
kind: Deployment
metadata:
  name: minio-deployment
  labels:
    app: minio
spec:
  replicas: 1
  selector:
    matchLabels:
      app: minio
  template:
    metadata:
      labels:
        app: minio
    spec:
      containers:
      - name: minio
        image: minio/minio:latest
        command:
        - /bin/bash
        - -c
        args:
        - minio server /data --console-address :9001
        ports:
        - containerPort: 9000
        - containerPort: 9001
        volumeMounts:
        - name: minio-data
          mountPath: /data
      volumes:
      - name: minio-data
        persistentVolumeClaim:
          claimName: minio-data-pvc
---
apiVersion: v1
kind: Service
metadata:
  name: minio-service
spec:
  selector:
    app: minio
  ports:
    - protocol: TCP
      name: minio-port
      port: 9000
      targetPort: 9000
    - protocol: TCP
      name: minio-console-port
      port: 9001
      targetPort: 9001
---
apiVersion: v1
kind: PersistentVolume
metadata:
  name: minio-data-pv
  labels:
    app: minio-data-pv
spec:
  storageClassName: ""
  capacity:
    storage: 2Gi
  accessModes:
    - ReadWriteOnce
  hostPath:
    path: /mnt/f/dev/data/minio-data
---
apiVersion: v1
kind: PersistentVolumeClaim
metadata:
  name: minio-data-pvc
spec:
  volumeName: minio-data-pv
  storageClassName: ""
  accessModes:
    - ReadWriteOnce
  resources:
    requests:
      storage: 2Gi
minio 설정
tempo의 설정에서 minio의 bucket과 access key, secret key를 지정하였었다.
해당 설정대로 Buckets -> Create Bucket에서 tempo bucket을 생성하고

Access Key -> Create access key에서 access key를 생성한다.
사용자가 직접 access key와 secret key를 지정하여 만들 수 있다.

Grafana에서 Tempo 추가하여 사용해 보기
grafana는 이전 글에서 이미 설치하였었다.
2023.03.15 - [Study/Docker & Kubernetes] - kubernetes에 Prometheus, Grafana 설치해 보기
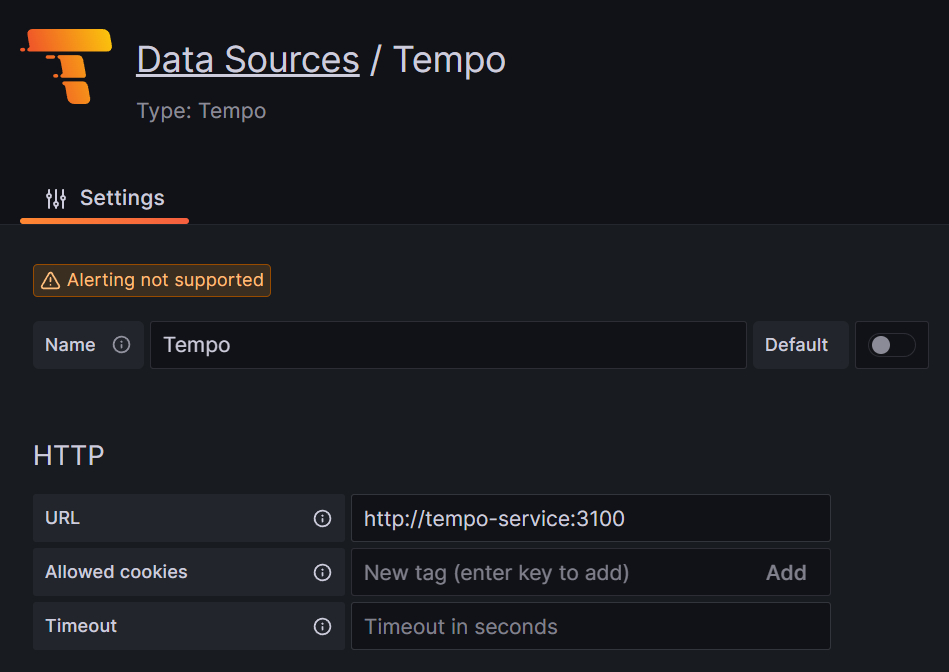
하단의 Configuration 메뉴 -> Add new Data source로 tempo를 추가한다.
위 설정대로 진행하였으면 url은 http://tempo-service:3100이다.
여기까지 별문제 없이 진행하였으면 trace를 수집하는 것을 확인할 수 있다.
grafana의 explore로 이동하여 Tempo를 선택한 후

데이터가 수집되었다면 Search의 Service Name에 대상 service 이름이 뜨는 것을 확인할 수 있다.

상단의 Run query를 실행하면 trace 검색도 정상적으로 된다.

Spring Cloud Feign을 사용할 경우 추가 설정
trace id가 application 별로 따로 설정되어 호출에 대해 여러 application 간 추적이 되지 않았다.
이유는 요청을 하는 application에서 feignClient를 사용하는 경우 feignClient의 request header에 trace 정보를 같이 넘겨주지 않아서이다.
trace 정보를 넘겨주어야 넘겨받은 application에서 trace 생성 시 해당 정보를 위임받아 설정하게 된다.
FeignClient에 trace 관련 처리를 하려면 feign-micrometer 의존성을 추가해 주고
<dependency>
    <groupId>io.github.openfeign</groupId>
    <artifactId>feign-micrometer</artifactId>
</dependency>
Feign.Builder bean에 Micrometer 관련 bean 설정을 추가해 준다.
@Bean
Feign.Builder feignBuilder(MeterRegistry meterRegistry) {
    return Feign.builder().addCapability(new MicrometerCapability(meterRegistry));
}
이렇게 설정하면 여러 application 간 호출이 추적되는 것을 확인할 수 있다.

'Study > Docker & Kubernetes' 카테고리의 다른 글
| Rancher Desktop의 Traefik 사용 시 Dashboard 활성화하기 (2) | 2025.01.05 |
|---|---|
| OpenTelemetry Collector extension 사용해 보기 (0) | 2024.12.27 |
| spinnaker resource (component sizing) 설정해 보기 (0) | 2023.04.07 |
| kubernetes pod에 resource 설정해 보기 (0) | 2023.04.06 |
| kubernetes에 Promtail, Loki 사용해 보기 (1) | 2023.03.21 |
| helm chart로 kubernetes yaml 파일 만들기 (0) | 2023.03.17 |
| kubernetes에 sonarqube 설치 & jenkins에서 사용해 보기 (0) | 2023.03.16 |
| kubernetes에 Prometheus, Grafana 설치하고 metric 정보 수집해 보기 (1) | 2023.03.15 |
| kubernetes ConfigMap, Secret 사용해 보기 (0) | 2023.03.11 |
| kubernetes PersistentVolume, PersistentVolumeClaim 사용해 보기 (0) | 2023.03.11 |


